Are you planning to file a patent application?
Don’t forget to add citations!
When a new patent is filed, the inventor references the existing prior art, and demonstrates how the new invention represents an advance over this prior art. It may look boring to do, but numerous validation studies have revealed the existence of a strong positive relationship between citations and technological importance. However, the nature of this impact is not explicitly clarified in these previous studies, so we tried to do it as a true data scientist would!
We will analyse the data which comprise detailed information on almost 3 million U.S. patents granted between January 1963 and December 1999. The patent dataset is maintained by the National Bureau of Economic Research (NBER). We downloaded them at the following “link”.
At first we will do exploratory analysis on the dataset, trying to find some general trends and answering some insightful questions. We will end up using a mix of variables to evaluate each patent’s influence both on the academic and economical side.
- Is there a trend for the number of patent grants during the years?
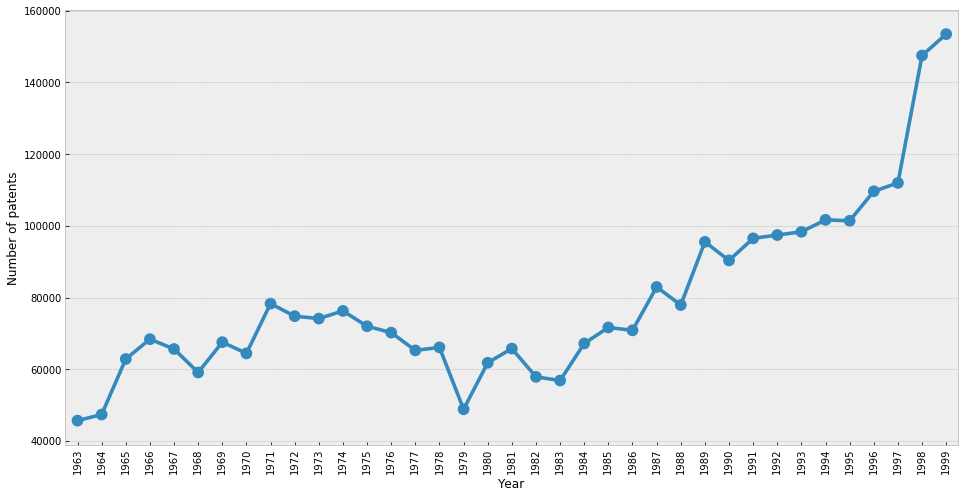
We can see that the number of granted patents is constantly increasing through the years, except for the period from 1974-1983 when there was some decrease, probably caused by some events in the world.
- Which countries have the most assigned patents?
The map shows number of patents by country of origin for patents from year 1998.
You can click on every country to see the exact number of patents.
As expected, United States are in the first place with 80291 registered patents, and they even have more patents than all other countries together. In second place is Japan with 30840 patents and then is Germany with 9095 patents. From the results we can see that the patents are unevenly distributed, there are only three countries with more than 9000 patents, and only one country with more than 50000 registered patents. All other countries have less than 4000 registered patents during the year 1998.
- What are the most popular technology fields for patents through the years?
In this section, we are interested in changes in number of patents in each technology field thorough the years.
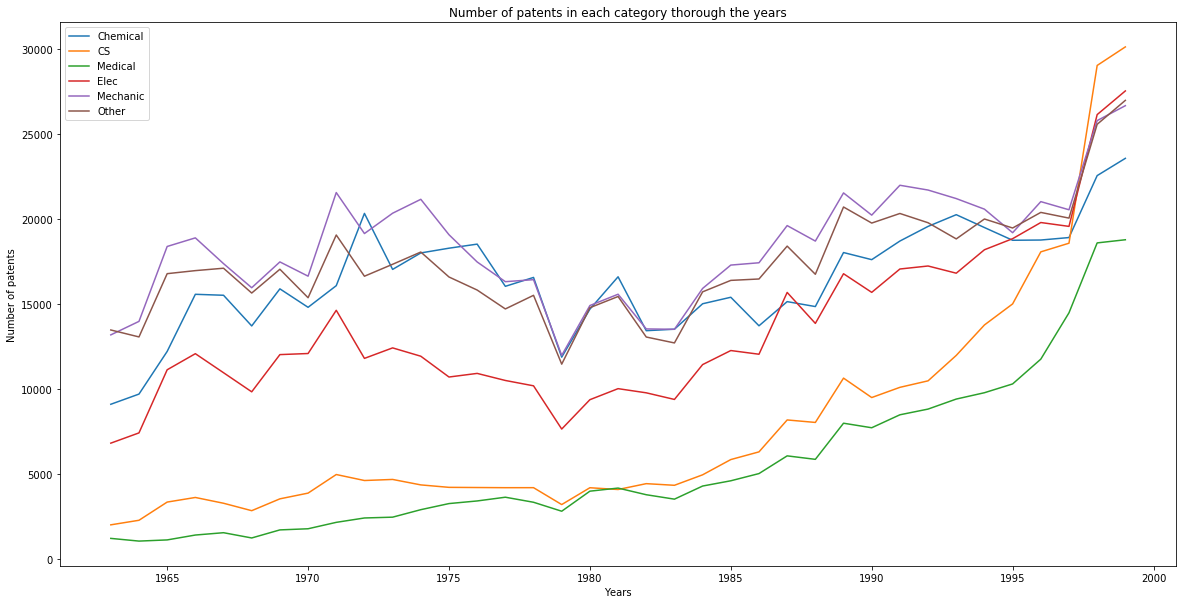
So according to the graph above the most popular technology field from 1965 to 2000 was Mechanics. In general every technology field’s line follow similar pattern except Computer Science and Medical Science, which increased dramatically over the 40 years. Interestengly, there is noticeable gap in 1979 in all fields. In general, we can say electronics and mechanics are popular fields but Computer science is the most trending field and have tendency to become the most popular field since 2000.
- What’s the most frequent technology field by inventor’s country?
In this section, we are interested in most frequent technology field by inventor’s country.
Since there are so many countries, It would be not very informative to analyze each countries. Thus we will focus on 5 countries with highest number of patents in total.
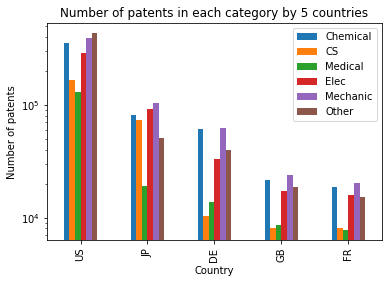
The graph above shows interesting relation, which is computer science inventors from US and Japan are much more higher than that of other countries. And also, these 2 countries have more inventors than any other countries. Other than that this bar plot shows similar trend with previos section’s results.
Patent citations
One part of this dataset is a network(graph) dataset, so will focus now a little bit on it. We will try to analyse patent citations and answer some questions.
First let’s try to visualize the dataset. Because the graph dataset is too large with more then 3 million nodes and more then 16 million edges, we will show just one small part of it.
The next graph is showing Swiss patents from year 1998 which are cited by patents granted in United States.
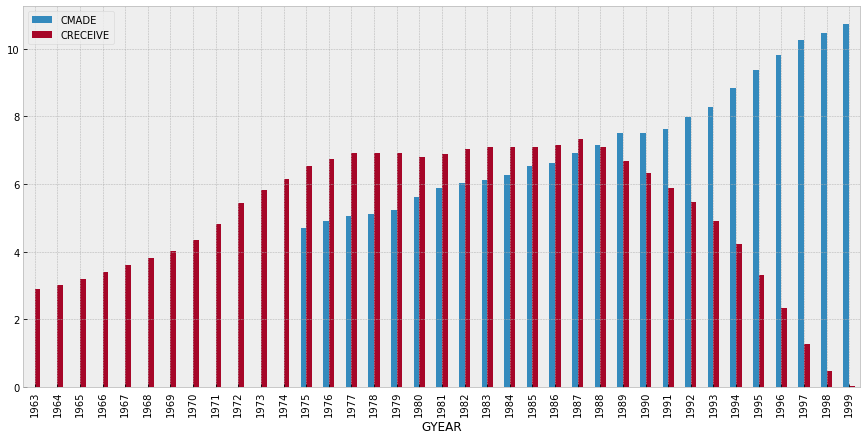
- Are the citations made and the citations received increasing with passing of the years?
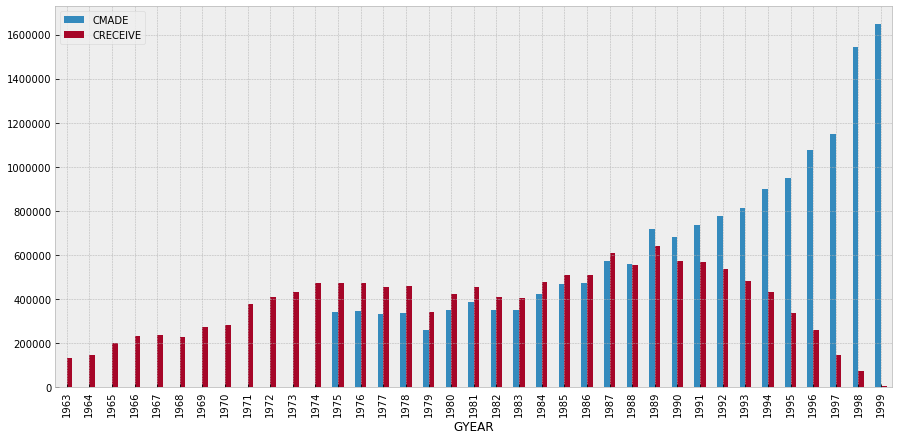
We can see that the citations made are missing for years before 1975. The citations received decrease linearly the last 10 years, this makes sense because a new patent is less likely to have many citations.
So far we showed the absolute numbers, but would make more sense to analyse for each year the citations relative to the total number of patents granted in that year.
We can still notice an increase in the citations both made and received over time, probably because of the globalization and the world wide web, which made easier to access information from all over the world.
- How does the number of citations relate to the category of the patent?
We use the variable “CAT”, which inform about the macro category of the patent. There are 6 classes:
Chemical
CS
Medical
Elec
Mechanic
Other
The category “other” includes Textile, Heating, Food and other miscellaneous.
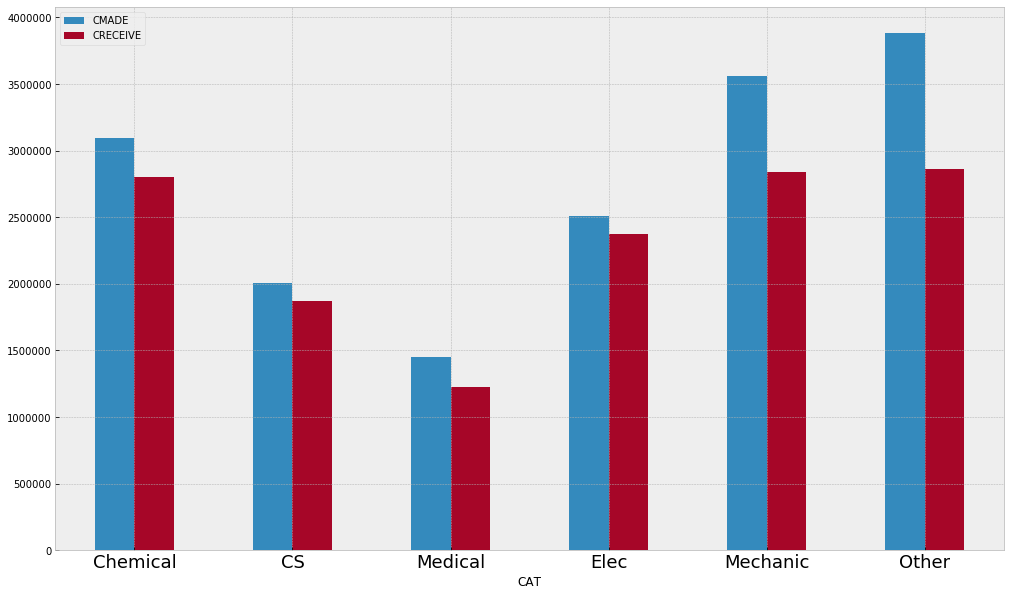
As before, for a more meaningful visualization is better to divide for the total number of patents that a category has.
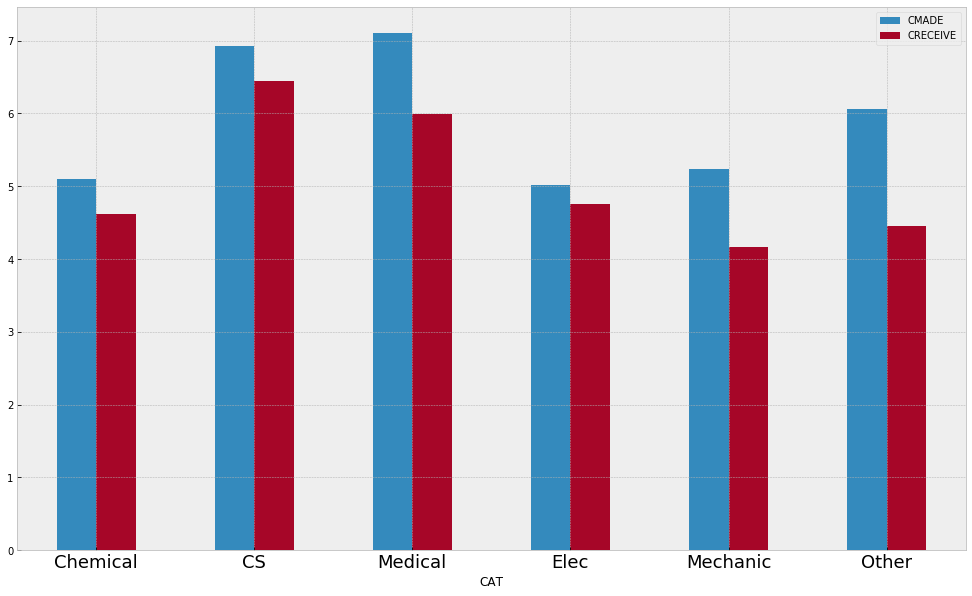
The bar plot shows that patents in Computer Science and Medicine are more cited and make more citations as well. The citations received are always less for the contribute of the novel patents that we showed before.
Citation lag
The forward lags focus on the time difference between the application or grant year of the cited patent, and that of the citing patents. And thus, we can measure probability of recieving citation since the grant.
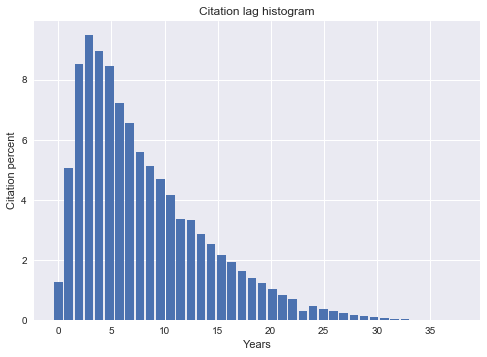
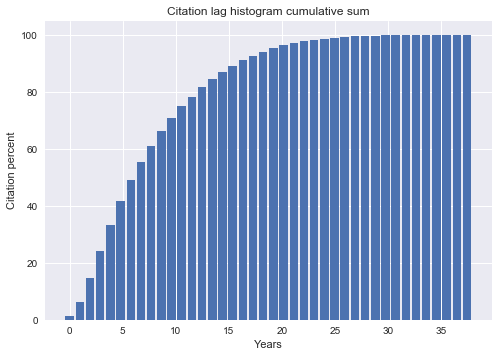
According to our graph, almost 40 % of the total citations were made within 5 years since the grant, and 80 % after 13 years.
The impact criteria
The number of patents and their quality is important index of country’s innovation and economic growth. However, according to our dataset, the total number of patents granted by only US Patent and Trademark Office (USPTO) from 1963 to 1999 is almost 3 million. In other words, over 200 patents were granted per day, and it’s increasing over time. Such exponential growth raises important questions like “How can one measure patent’s quality”, “How to distinguish high quality patents” and “Is it possible to predict, if patent is good or bad”. By answering to those questions, both researchers and business companies can benefit and save huge amount of assets and time.
In this section, we will try to measure both economical and academic impacts of each patents and try to find if there is any correlation or interesting relationship between them. In order to do that, we have used NBER patents dataset and fortune rankings list from 1963 to 1999
Defining Academic Impact
According to the https://www.nap.edu/read/5976/chapter/7, the number of patents issued and the technical and scientific literature citations on the patents can be used to develop quantitative measures of innovative output and science-technology linkages. Thus, to measure academic impact of each patent, we have used number of citations it has recieved using citations dataset. Even though our citation dataset contains only informations related from 1975 to 1999, there is over 16 millioin citation relationships between patents.
The number of citations each patent recieved isn’t good method to evaluate academic impact. Because, the patent which influenced another patent which has recieved huge amount of citations, might have bigger impact, but number of citations alone can’t represent such cases. So, we have measured second layer of citations, which is the number of citations of each citing patents recieved for given patent.
| first | second | |
|---|---|---|
| id | ||
| 1 | 2 | 3.0 |
| 13 | 2 | 2.0 |
| 24 | 1 | 1.0 |
| 29 | 1 | 5.0 |
| 31 | 2 | 3.0 |
The table above is the final result of our method.
- What features influence on academic qualities of patents? In order to answer this question, we have used Pearson Correlation Coefficient with 2 columns of “academic” dataset and 23 features in patents dataset. This coefficient will tell us is there linear relationship between 2 series, and if yes is it negative or positive. https://en.wikipedia.org/wiki/Pearson_correlation_coefficient .
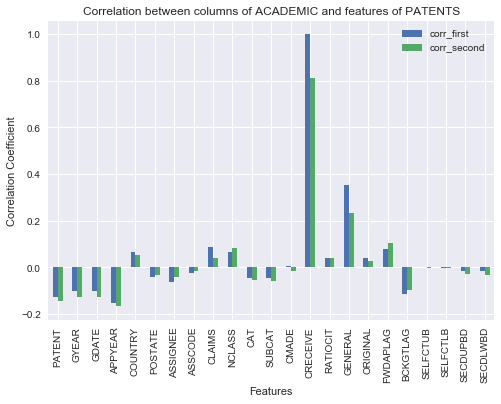
According to the graph the academic impact of each patents are decreasing as time passes, which can be explained by increasing number of patents in each year. As expected, the CRECIEVE feature, which is number of citations recieved has highest correllation. But also note that it’s value is 0.811 with second column of ACADEMIC dataset. And also, the generality which is measurement of how much scientific area does patent cover, has quite high correlation. In other words, the patents which covers wide area, have that much influence academically.
Defining Economic Impact
The dataset provided by NBER doesn’t have any information related to economy except the company names of each patents are assigned to. Thus, in this section, we have scraped Fortune magazine’s rankings of top 500 companies in US over 1963 to 1999, with their revenues and profits in million (http://archive.fortune.com/magazines/fortune/fortune500_archive/full/). By combining these 2 datasets, we can get patents information of each company owns and their economic measurements for given year.
| company | profit | rank | revenue | year | |
|---|---|---|---|---|---|
| id | |||||
| 1 | General Motors | 1459.1 | 1 | 14640.2 | 1963 |
| 2 | Exxon Mobil | 840.9 | 2 | 9536.9 | 1963 |
| 3 | Ford Motor | 480.7 | 3 | 8089.6 | 1963 |
| 4 | General Electric | 265.8 | 4 | 4792.7 | 1963 |
| 5 | Mobil | 242.3 | 5 | 3933.3 | 1963 |
The table above shows top 5 companies in US over 1963 to 1999.
We checked how much patents these top companies own and surprisingly almost 17% of the total patents is owned by only 1564 top groups. Moreover, it is only 3% of the companies that were mentioned in the PATENTS dataset.
What features influence on economic impact of patents?
In order to answer this question, we have used the similar method as academic.
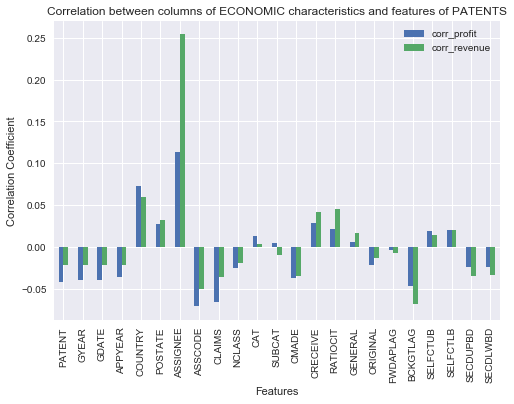
Obviously, the Assignee id has the highest correlation with revenues and profits. For the features related to time, we can see the same relationship with Academic correlations. Which also can be explained increasing number of patents. However, the inventor’s country plays big impact on economic impact, which is different from academics. And also, the number of claims each patent has negative influence on economics, while it was opposite in academics. But we can see interesting results in citation related features. For example, the number of citations made and originality of patent influence negatively in economy. And citations recieved has some degree of correlation (0.045).
The Comparison between Academic and Economic impacts
Now, since we have evaluated quantative measurements of both academic and economical impacts, let’s see their relationships. To do so, we first calculated total number of citations of each company’s patents has and the compared it with it’s revenue and profits using pair plot and correlation matrix
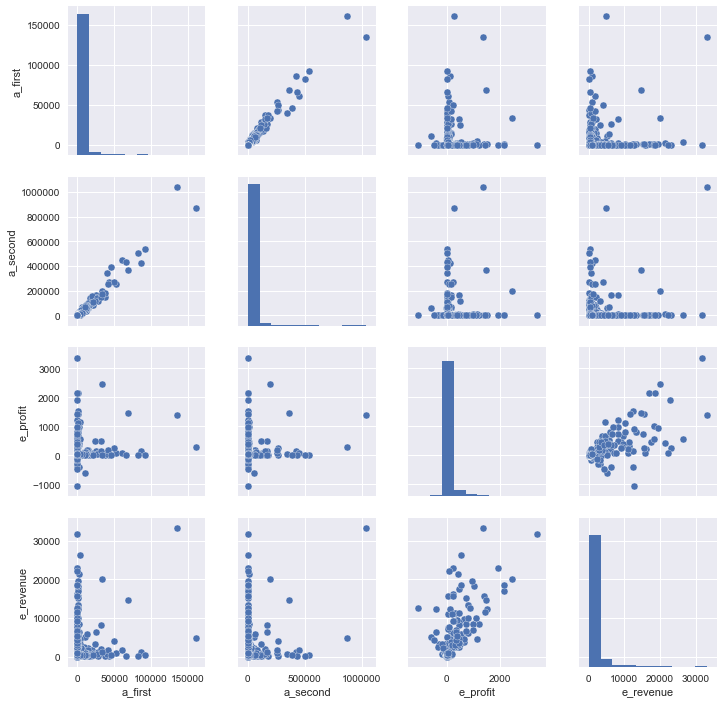
The highest relation between academic and economic feature was shown in “second” in ACADEMIC and company’s revenues. However, the correlation is still low and it might seem there is no correlation between academic and economic impact. But note that, this analysis is time independent and we have no knowledge about citations of patents that companies already had before 1975.
The Comparison between Academic and Economic impacts with TIME
In this section, we are dividing the previous analysis on each year. Note that instead of number of citations of each year, we took cumulative sum. The reason is, we also have to take account that given company has already owned previous patents, influencing company’s success. And also, we have used column “second” in ACADEMIC dataset for measuring academic impact, since it has considerably large correlation with “first” column.
Relationship between academic and economical impact of patents
| Name | Value |
|---|---|
| Company Name | |
| Number of patents | |
| Number of citations | |
| Company revenue | |
| Company main field |
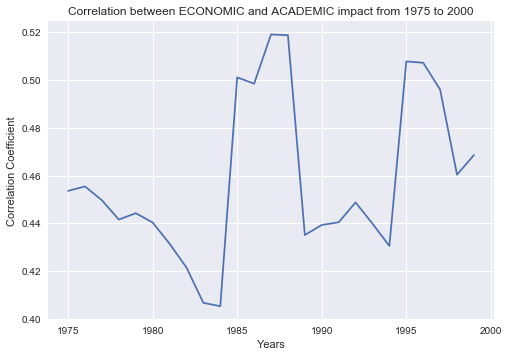
In general the correlation now is pretty high and showing clear evidence that ACADEMIC impact indead influence on ECONOMY. But interestengly, this graph might be inferring some historical events. For example around early 1980, there was global economical recession happened and it was ended around 1984. And also, through 1989 to 1991, due to inconvenient government policy economical recession happened. However the 1990 to 2000 is considered the golden years of US economy and in 1994 the number of jobs created were peaked. https://en.wikipedia.org/wiki/1990s_United_States_boom, https://en.wikipedia.org/wiki/List_of_recessions_in_the_United_States. Even though it is tempting to say that economic and academic relationship is somehow related to nations economical state and policy, further research and expertise are needed.
Conclusion
With this work we first analysed almost 3 million patents granted in US from 1963 to 1999, their citations from 1975 to 1999 and then tried to answer questions relating to their impacts.
From patent and citation analysis, we have reached following conclusions:
- Number of patents increasing exponentially
- Japan, Germany and some European country’s companies own high number of US patents
- Computer Science and Medical fields has grown significantly
- Most of the citations are made 5 years after the grant etc.
For the final part, since patents can have both economical and academical impact, we studied both impacts and their relationship. The academic impact can be measured by number of citations each patents received, but we couldn’t measure economical one with NBER data only. Thus we have scrapped Fortune 500 rankings from 1963 to 1999, and used each company’s economical characteristics. Once, we defined a way to evaluate impact, we have analysed correlation between each given features of patent. We observed some interesting relations, but our result implies our given features are not enough for building prediction model. However, there is positive relationship between academic and economic impacts.